Insights Overview
Anomalies & Correlations
One of the ways Fuzy helps product teams discover more "aha" moments is through automated insight detection in the form of anomalies and correlations. Examples of each are below.
Usage anomaly
Usage anomalies will alert you to abnormal product usage patterns from a specific segment on a certain date. Anomalies can be detected on any supported metric, an event, or group of events.
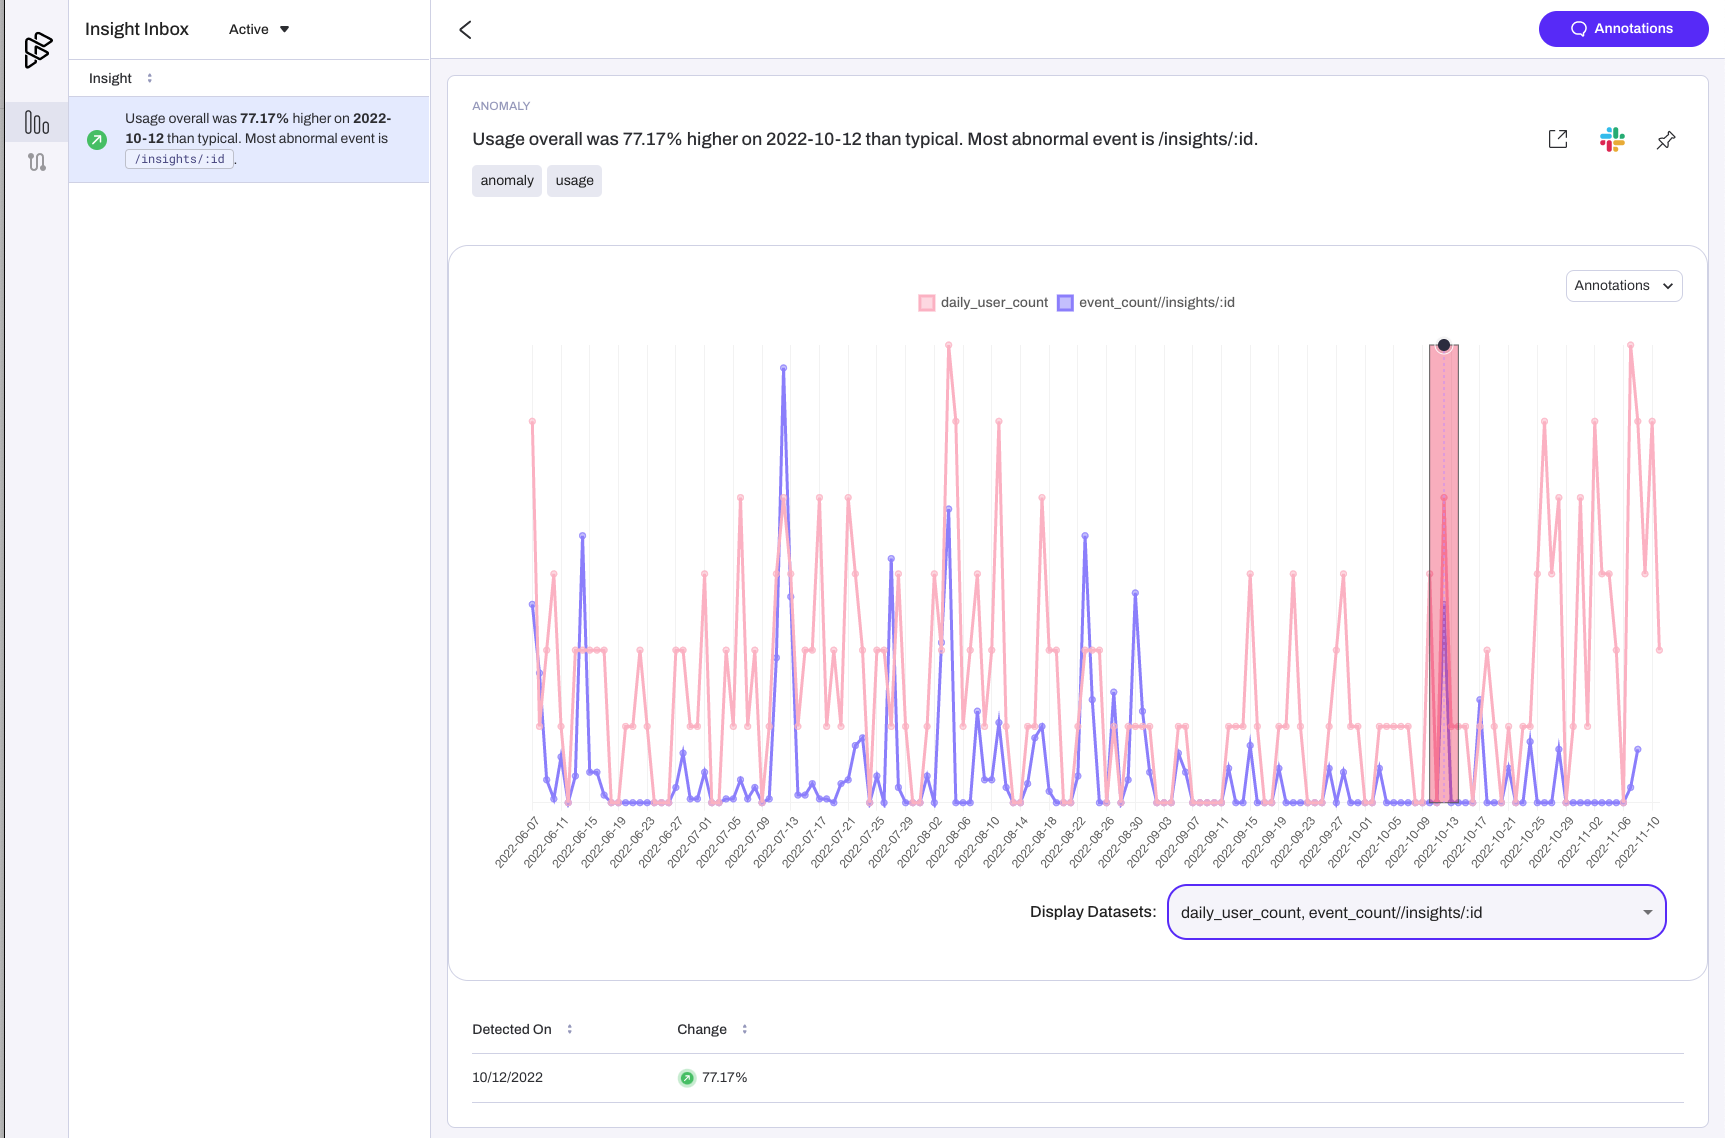
TipWhen viewing the insight details, you can layer other anomalous datasets from the same time period for more context. Once you've identified the root cause, help your team by creating a Timeline Annotation.
Target Correlation
With Fuzy, you can identify specific events (pageviews, button clicks, etc.), groups of events, or metrics (account churn, user stickiness, etc.) that your organization wants to monitor or is focused on improving. We call these Targets.
Fuzy's correlation insights are surfaced automatically to help your team understand the characteristics, specific user behaviors, and usage thresholds impacting those targets.
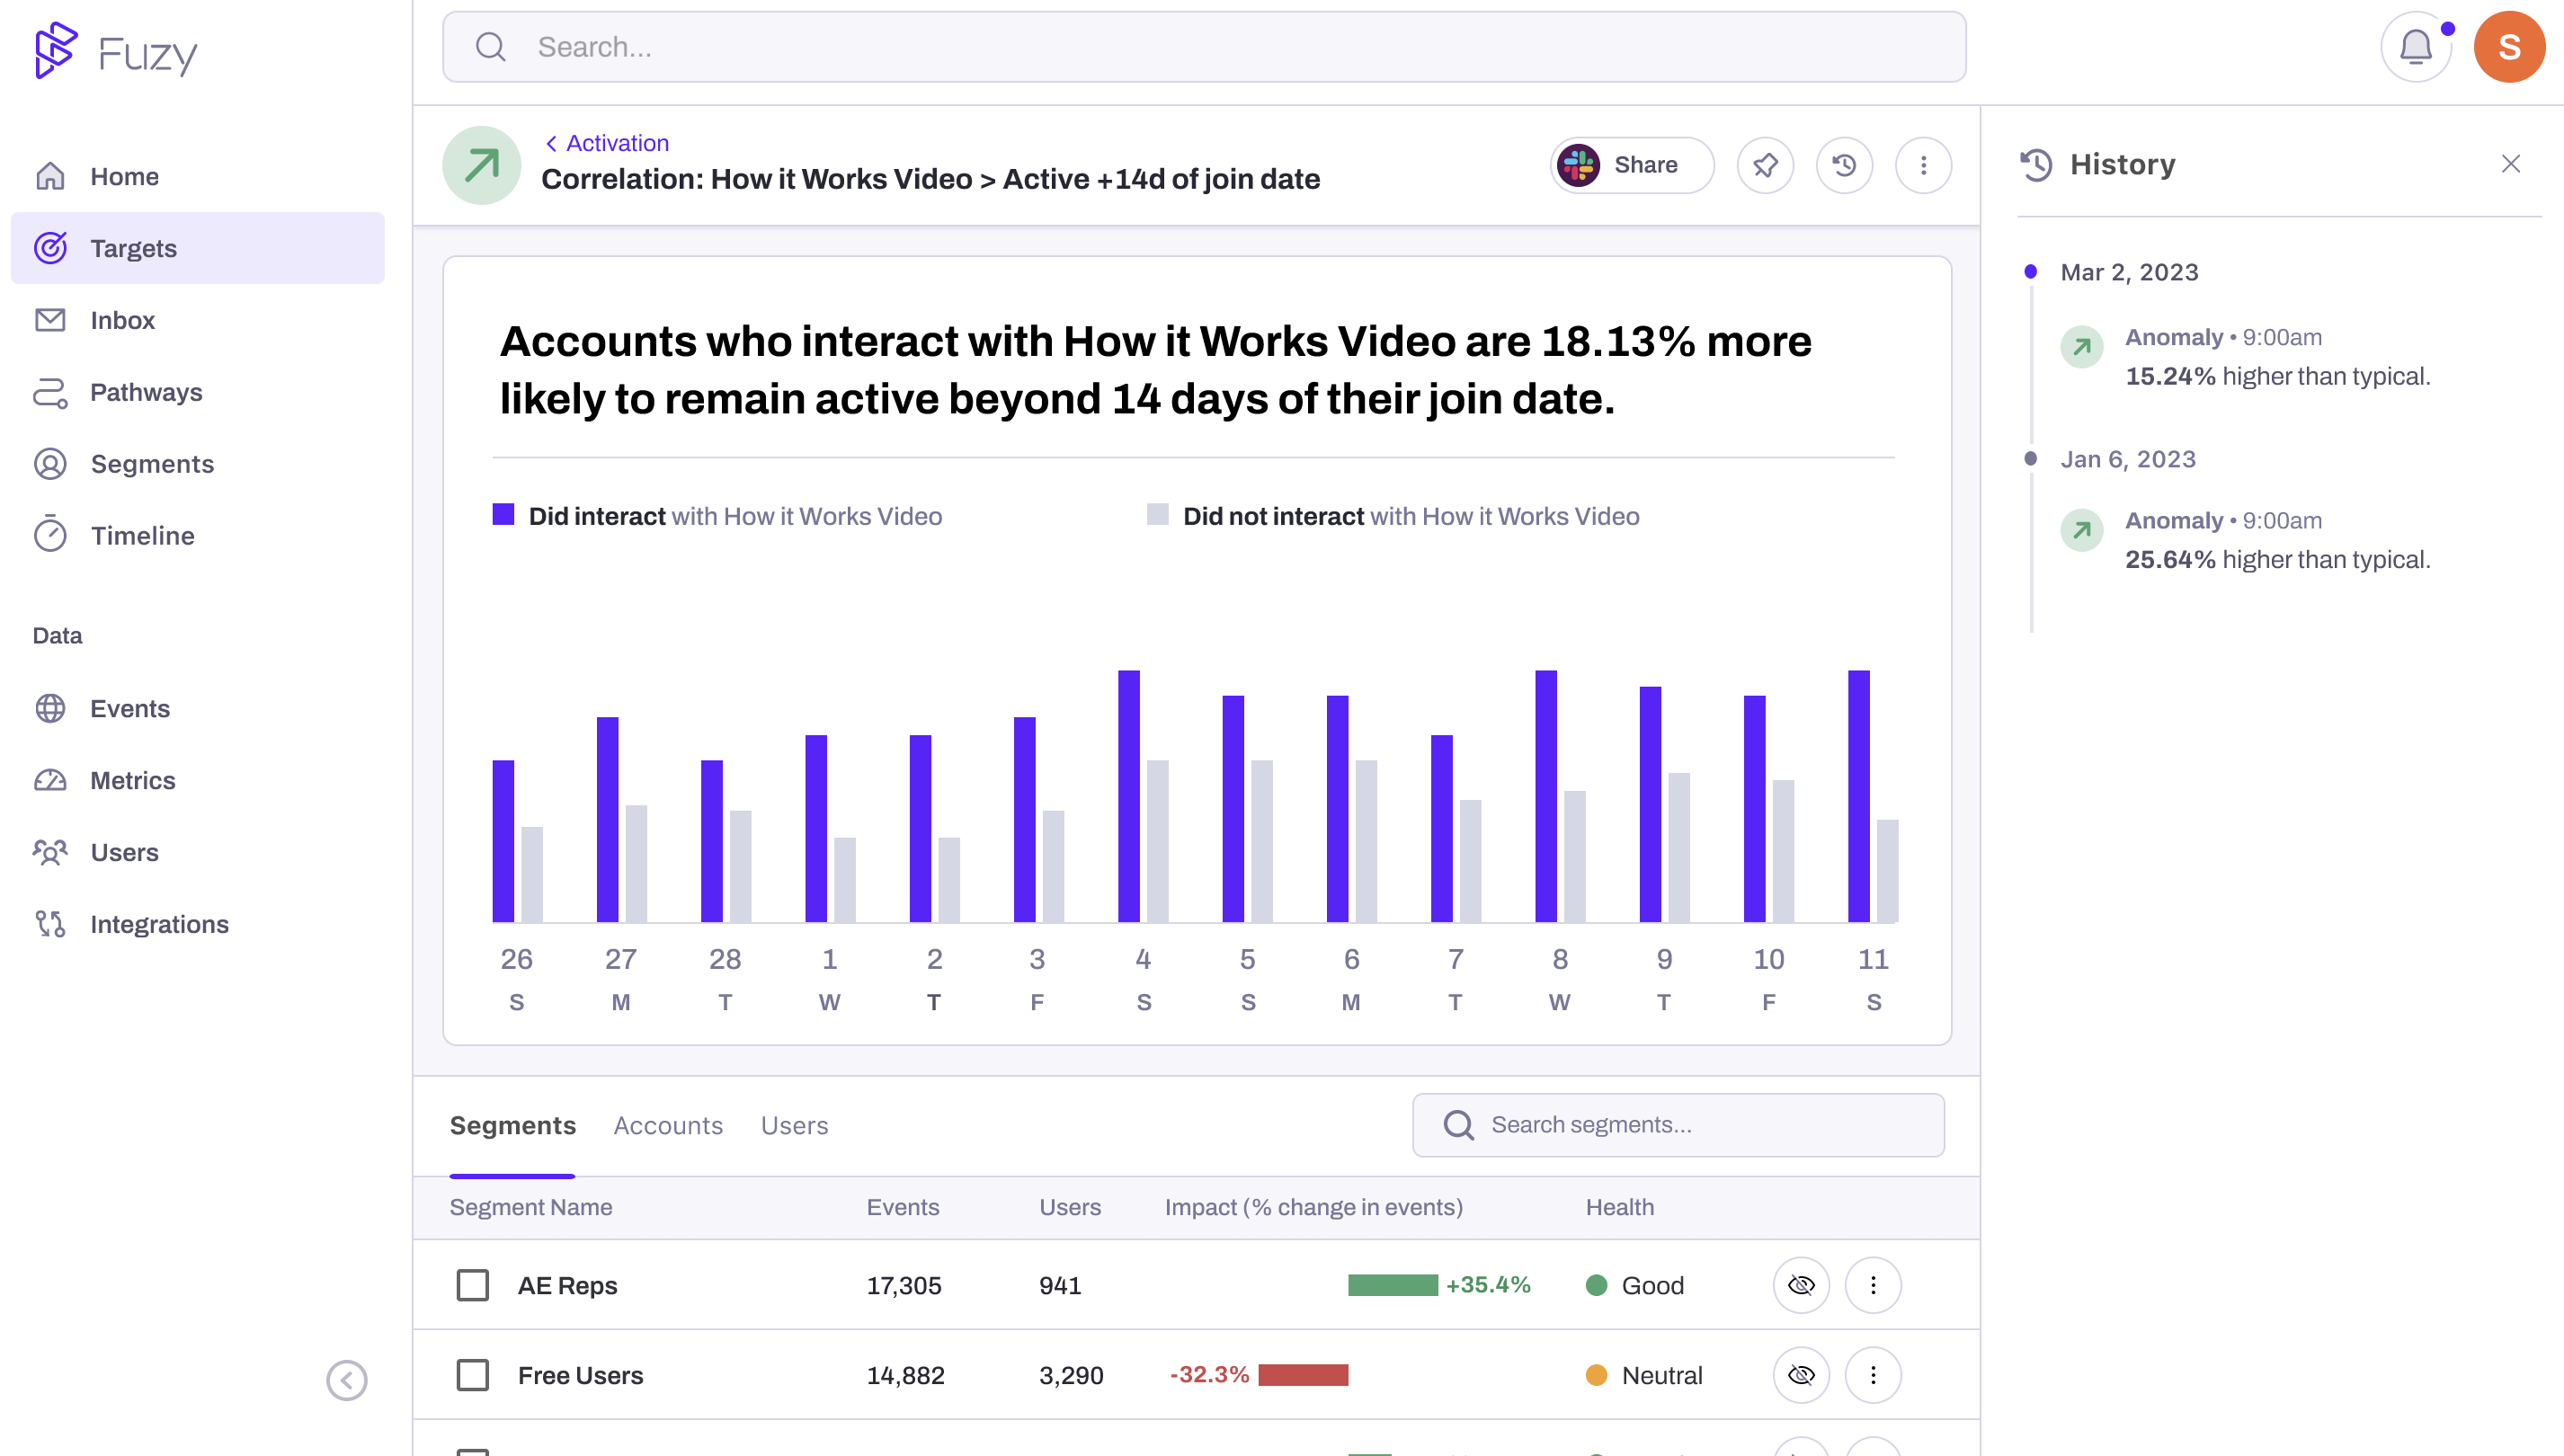
Example of Target Correlation
Data RequirementCorrelations require historical data. There are several factors that determine "how much" data is required including, the specific target or metric, the size of your user/account base, etc. Correlation models will only surface in your Fuzy app once they pass model quality assurance thresholds.
Updated about 1 year ago